-----
Calibration curve for multiple layer systems
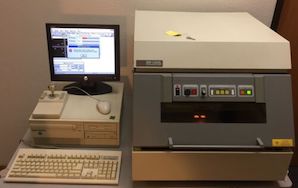
Q. Our work group in LTR-INETI works closely to a X-ray fluorescence instrument, a GXR-300 model. We do determinations of thickness and composition in various single layer, multiple layer and alloys materials.
Lately, we've been trying to develop a statistical analysis which reports the accuracy of a given result, depending of the application used, calibration curve and repeatability.
This development contemplates several applications, including Zn/Fe, Ag/Ni/Cu, Au/Ni/Cu, Au/Ni/Brass and so on. In single layer applications, like Zn/Fe, and top layer in the multiple layer applications, like Ag/Ni/Cu Au/Ni/Brass, we had no problem in adjusting the calibration curve to a logarithmic curve. This is is consistent with the excitation mode used for single layer measurements.
The problem arises when trying to adapt the same curve to an intermediate layer, like Ni in the Ag/Ni/Cu or Au/Ni/Brass applications. It seems that there is both excitation and absorption principles in effect. We were not able to get the function's curve of the Ni layer.
I'm looking for any information about the function (count rate vs thickness) of the intermediate layer in multiple layer applications.
Best regards,
National Institute of Engineering Technology and Innovation - Lisbon, Portugal
2006
A. My best advice would be to work with the applications scientist that supports your XRF instrument. He/she should be willing to help you develop this method.
Terry Tomt- Auburn, Washington
Q, A, or Comment on THIS thread -or- Start a NEW Thread
